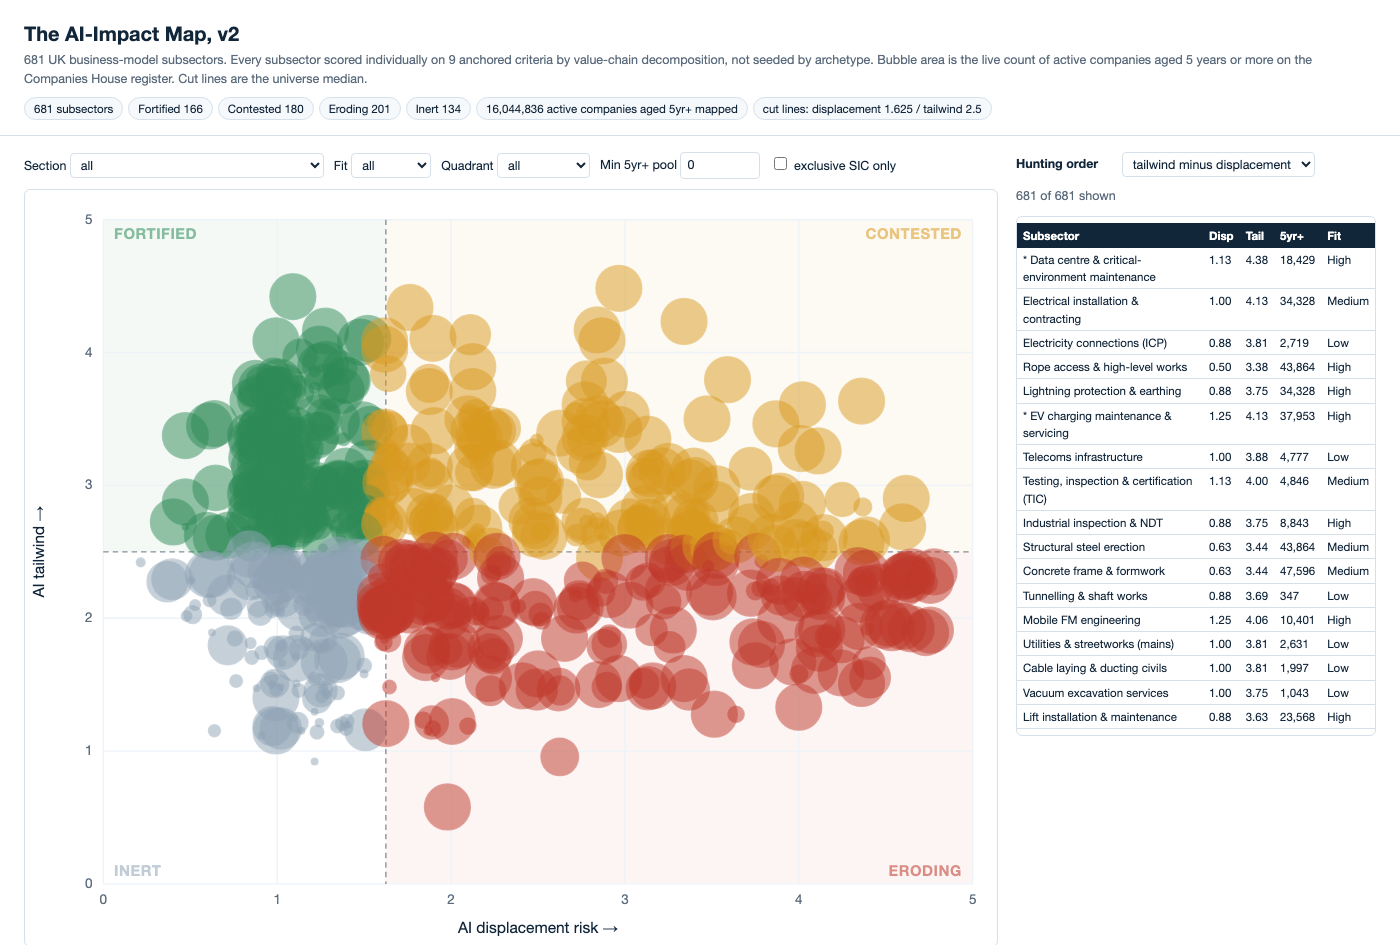
681 UK subsectors scored on two independent axes, with live company counts. The most useful thing I learned had nothing to do with the answer.
"Which industries will AI eat" is usually answered at the level of a category. Legal. Accounting. Marketing. That is the wrong altitude, because AI acts on tasks, not on categories, and every category is a bundle of tasks with wildly different exposure.
My first attempt scored two axes per archetype and let 681 subsectors inherit their archetype's position. It had no company counts, and a roll-up fit column I could not define precisely. Someone took it apart in about four questions on a call, and every one of those questions was fair. This version fixes exactly those three things and nothing else.
Displacement risk asks whether AI can do the job instead of the incumbent. Tailwind asks whether AI lifts the business without replacing it, mostly through demand for the physical and regulated work that AI infrastructure itself creates.
They are independent, which is the point. A subsector can score high on both, which makes it Contested. It can score low on both, which makes it Inert. The interesting corner is high tailwind and low displacement.
Every subsector is scored individually on nine anchored criteria, five for displacement and four for tailwind, each on a 0 to 4 scale with a written anchor for what each level means. The axes are the weighted mean rescaled to 0 to 5. All the arithmetic lives in code, and every weight, anchor and threshold sits in one assumptions.json, so a challenge can be re-run rather than argued about: change the value, re-run the compute step.
The cut lines are the universe median, 1.625 on displacement and 2.5 on tailwind, not a line fitted to make the answer look tidy.
To check whether the scoring was reproducible, I deliberately scored 50 subsectors twice, with two different models as judges, and compared them.
Exact agreement was 33%. The mean difference was 1.04 levels on a 0 to 4 scale, and on tailwind the two judges sat 1.39 apart on a 0 to 5 scale. Worse, the disagreement was systematic rather than noisy. The smaller model scored electricity transmission tailwind at 1.12 where the defensible answer is around 3.75, and scored stocktaking displacement at zero.
That matters far beyond this project. When your quadrant boundary is a median, mixing two judges across one scored universe silently sorts one judge's rows into different quadrants than the other's. The map looks finished and is quietly incoherent. I re-scored all 681 with a single judge and kept both passes in the repository so the comparison stays inspectable.
If you take one thing from this: never mix judges across a scored universe, and if you are using an LLM as a rater, measure inter-rater agreement before you trust a single output. It is a cheap test and it is the difference between an instrument and a picture.
Bubble size is a real number, not an impression. Counts come live from the Companies House advanced-search API, queried per five-digit SIC code across all 731 codes, on two measures: active companies, and active companies incorporated on or before a five-year cutoff.
The honest caveat is that 251 of the 701 mapped codes are claimed by more than one subsector, so those counts are upper bounds. Every row carries a flag saying so, plus a lower-bound column counting only codes exclusive to that subsector. 531 of the 681 rows are flagged.
What is deliberately missing: no financials by subsector, because the UK profit-and-loss exemption means small companies do not file one; no ownership filter; and these are register counts, not qualified targets.
Fortified 166, Contested 180, Eroding 201, Inert 134. Thirty-seven subsectors are Fortified and have a buyable pool of companies behind them.
Top of the list is data centre and critical-environment maintenance, displacement 1.12 against tailwind 4.38, with roughly 18,400 companies aged five years or more. Then electrical installation and contracting, EV charging maintenance, renewables operations and maintenance, lightning protection, industrial inspection and NDT. The pattern is not subtle: the work that AI infrastructure physically requires, done by people who have to be on site, holding a certification.
The eroding end is equally blunt, and closer to home for anyone reading this. SEO and digital marketing, translation and localisation, transcription and captioning, directory publishing and data entry all score 4.75 on displacement.
The uncomfortable version of the conclusion: the safest businesses on this map are the ones that need a van, a qualification and a physical site. The most exposed are the ones that were themselves the last wave of automation.